We’re pleased to announce the first release of our Red Reactor Battery Widget, so you can see the battery status right from your desktop screen! Perfect for when you use the Red Reactor to make your Pi project portable, or you just want to make sure all is well in case you loose mains power.
The battery icon will show you the percentage charge, and during charging and discharging you can also see the battery current and voltage in the tooltip when you hovver over the icon. We have done a number of experiments to create a mathematical model that calculates the remaining time to full charge, and how long you can keep going before you run out of juice!
The software is available for download from our Github repository. It is designed to read the battery usage from the Red Reactor, with a configuration file to support different battery capacities. But before you head over to download and install it, let’s take a look at battery profiling.
The Red Reactor Battery Widget for Raspberry Pi and similar SBC's
What's my battery life?!
Of course every project has different power demands:
What kind of application are you running?
Which Raspberry Pi you are using?
How much power is needed by your USB accessories?
How busy is the CPU and/or GPU?
Is it using WiFi and Bluetooth?
What’s plugged into the header ports, like a display or a camera?
Whilst all these elements are constantly changing their power demands, we’ve run a number of experiments to create charge and discharge profiles that map the power requirements to estimated battery life.
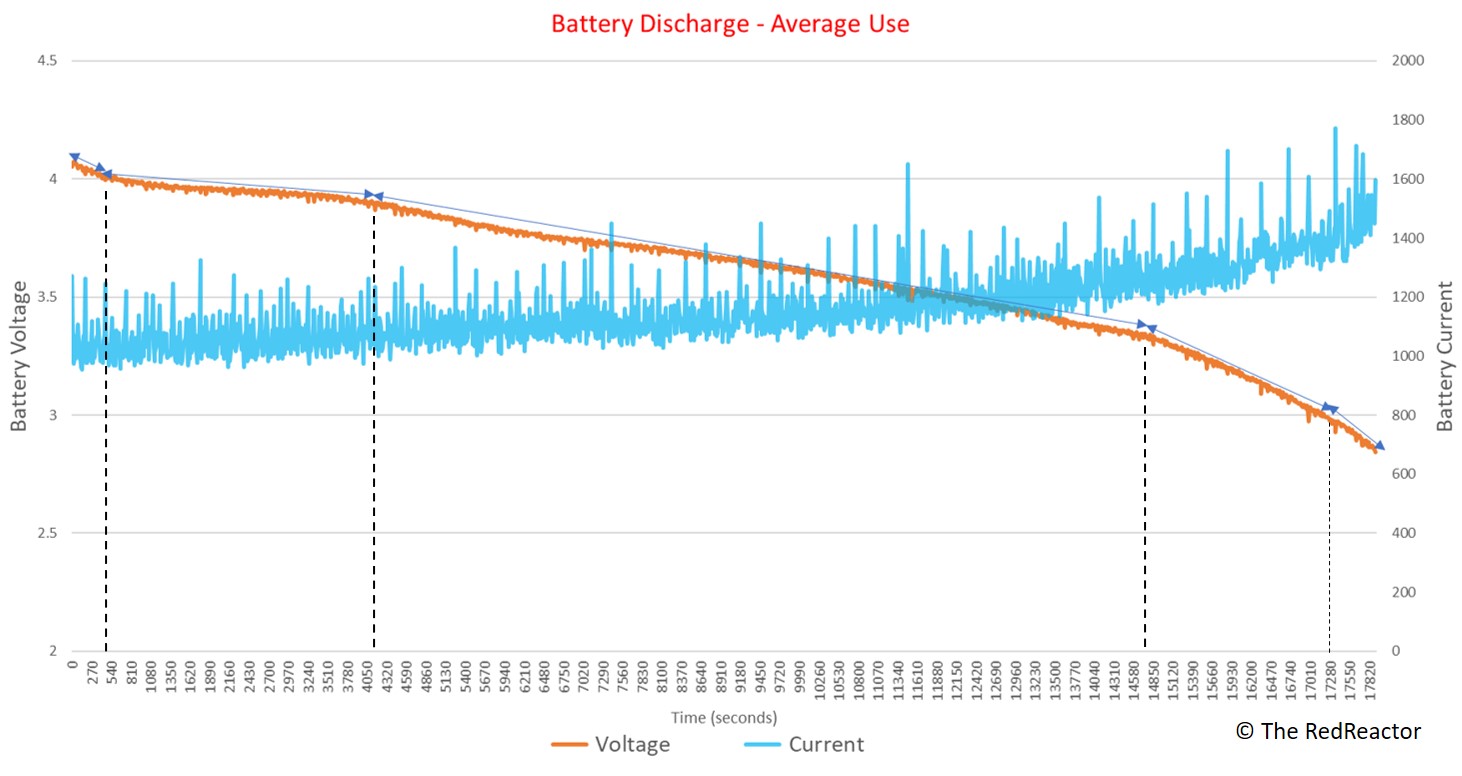
Figure 1 : Battery Discharge Measurements (click to enlarge)
In Figure 1 you can see the battery discharge graph for a setup using a Pi3, touch screen display, USB hub (powered by the Pi) that has a keyboard and mouse, consuming around 1100mA. Since the power draw stays roughly constant, then as the battery voltage reduces, the battery current required slowly rises up. From this we created a mathematical model that computes the number of minutes and hours left to run.
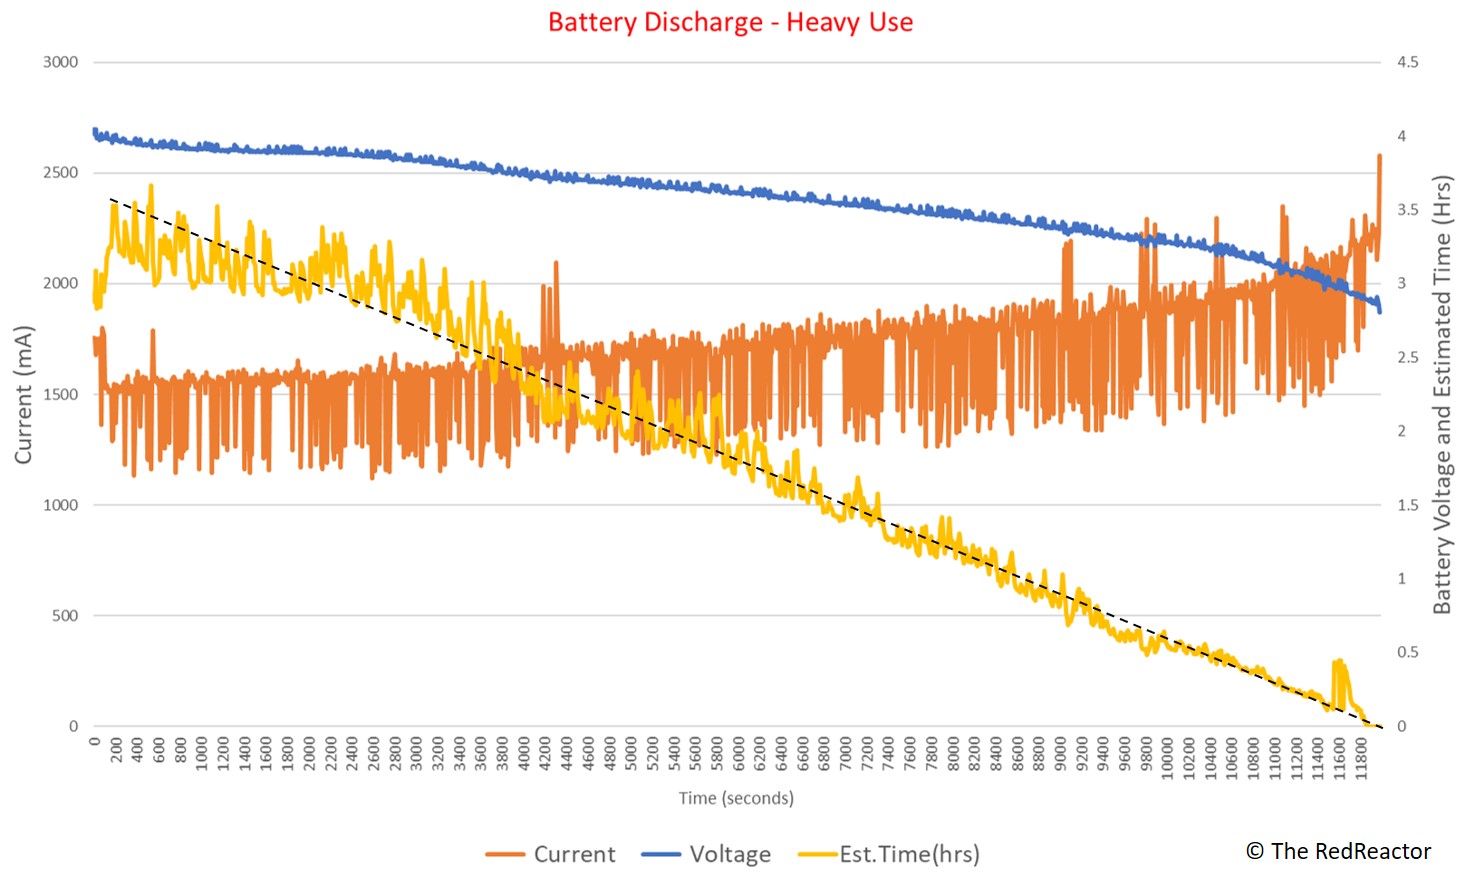
Then we repeated the experiment, see Figure 2, but this time the Pi was running the graphics stress test, so the system was drawing a much higher current. You can see the current profile is quite spikey and the CPU/GPU was temperature throttling the number of frames per second for brief periods. Note that there were no under-voltage warnings throughout, as the Red Reactor is designed to provide a super steady 5.1volts even as the current demand rises instantaneously. Again the battery current rises as the battery voltage reduces, to satisfy the power demand.
On this figure we also plot the calculated time remaining (in yellow). Of course, in this example the usage is varying significantly due to repeated temperature throttling, hence the time calculations vary as well, but you can see that the overall trend is accurately running down to zero when the battery runs out!
Figure 2 : Heavy Use and Estimated Time Remaining (click to enlarge)
During our testing we also observed that whilst the batteries will measure at 4.2 volts when fully charged, the moment they have to deliver current their internal resistance causes that voltage to drop immediately to around 4~4.1v, and we’ve added that to our model.
What about battery charging?
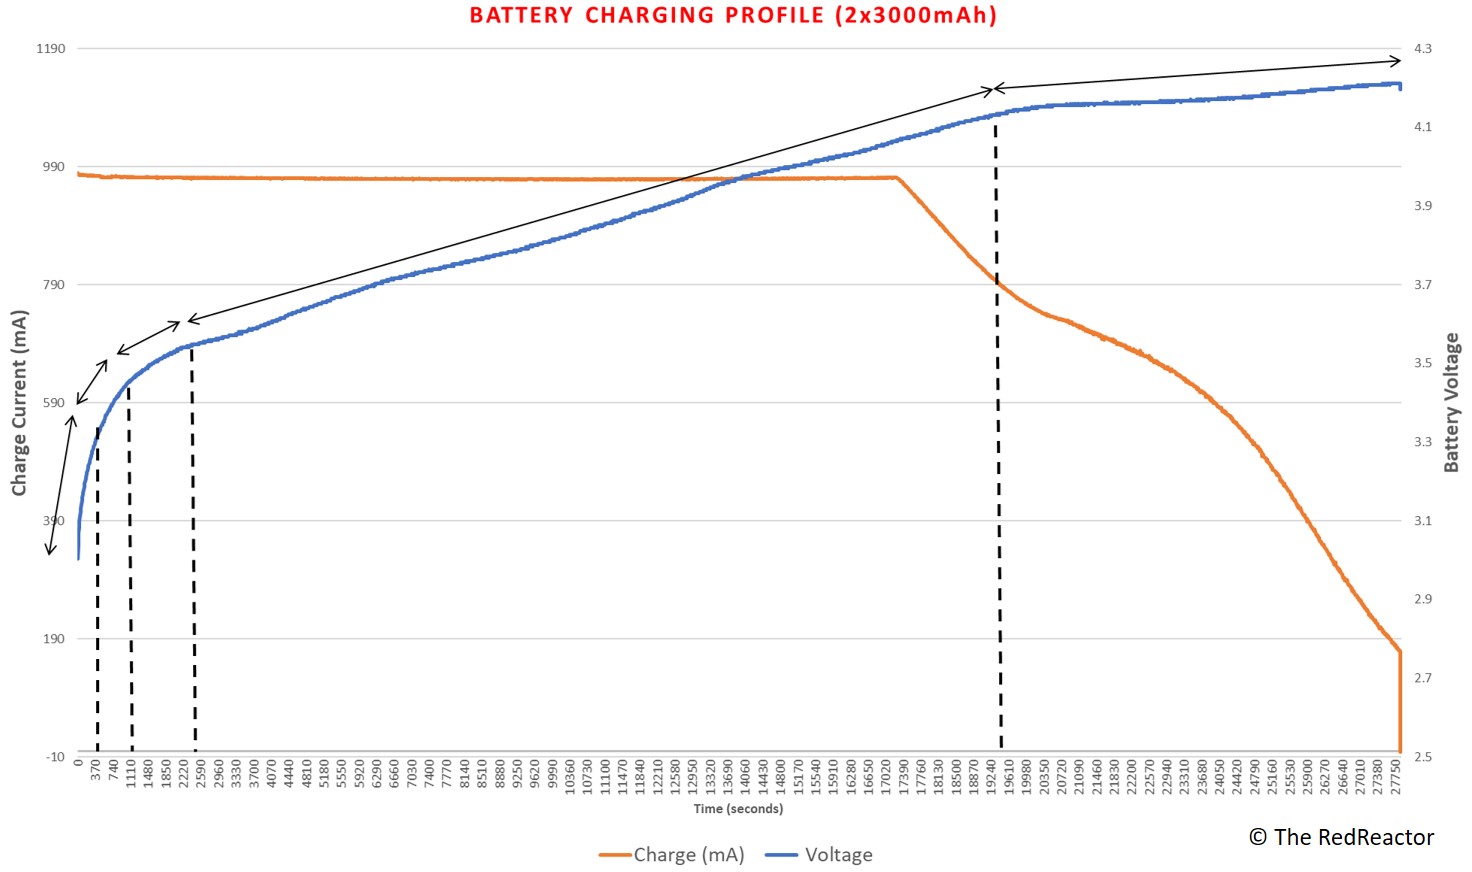
Figure 3 shows the battery charging measurements. The charging profile switches from a trickle current below 3v (not shown in this figure), to a constant current model (at ~1 Amp) until a final constant voltage stage during which the charge current decreases to a cut off point when fully charged. The figure shows how the model divides this process up into similar stages to identify remaining time to full charge. (Note, the arrows are offset from the graph for clarity).
But not only does the battery widget show you remaining time, it also displays the voltage and current so you can see for yourself what your system is doing, with all the data recorded into a log file as well. If you need longer battery life this data can help you track down what to optimise!
Figure 3 : The Red Reactor Battery Charging Profile
Our Raspberry Pi battery widget is designed specifically for the Red Reactor, but includes a config file that allows you to adjust the available capacity according to your chosen 18650 batteries. The installation procedures are provided on the Github page, which updates your autostart file so the widget runs every time you power up your Raspberry Pi!
The code is available now on Github and we would love to hear your feedback.
We have just updated the Github code with some new features – a pop-up warning when down to 10% capacity and a 30 second timer to automatic shutdown after the battery empty warning. Just follow the install or update instructions to keep all your data safe!


We have just updated the Github code with some new features – a pop-up warning when down to 10% capacity and a 30 second timer to automatic shutdown after the battery empty warning. Just follow the install or update instructions to keep all your data safe!