

Web based Remote Monitoring
Welcome to yet another feature release for the Red Reactor!
Previously we released our pi-battery-widget so you can see the battery status directly on your Pi display, and then we demonstrated how the Red Reactor’s ultra-low stand-by current is unique in enabling many months of sensor monitoring on a single battery charge. But what if you have a remote unit or device without a display that is running constantly, and you need to monitor battery state, mains status and even remotely control shutdown or restart?
Well, let us introduce our new Remote Monitoring web-application, designed to run on your Pi giving you full control and a status display via your web browser or mobile device!
The screenshot is shown on the right. The first few entries are part of a form input that allow you to customise the monitoring process, by changing:
- the refresh interval
- a countdown timer to automatic refresh is shown bottom right
- the number of samples to record and show on the screen
- the number of samples to use for averaging
- turn data logging ON or OFF
Just enter a new value and hit ‘Submit’! The log data is written on your Pi such that you can easily import it into Excel for further processing.
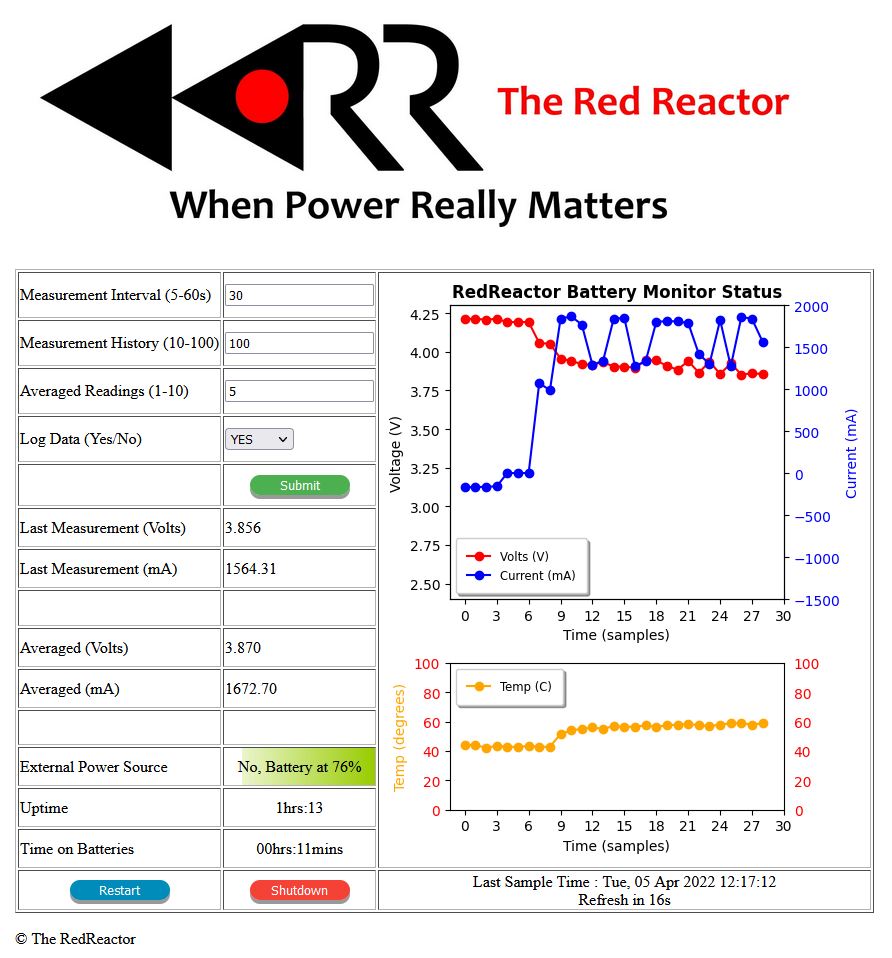
Each time the webpage is automatically updated it will contain a new graph showing voltage and current consumption histories, as well the Pi CPU temperature graph. The scales adjust to give you greater insight during charging and discharging cycles.
Since power consumption demands (and hence voltage and current) can vary rapidly depending on usage, the table shows both the exact last readings and averaged values.
A handy colour coded entry shows whether there is external power and the battery charge level, including fault detection. The table also shows total uptime and the time on batteries when there is no external power.
The Remote Monitoring application will automatically force a shutdown when the battery voltage reaches a minimum level (2.9v), but the web interface also provides both a Restart and a Shutdown button in case your own application is not responding or you want to reset the device manually. If you use a Crontab entry to start the Remote Monitoring application then you can easily access the web page again after booting up.
Simply download or update your Red Reactor codebase from our Github respository, start the Pi web server (install and run instructions are on our github page), and load the web-page into your browser!
The code is fully self-contained, and based on the Flask web server library. Please note that Flask is not designed as a production server, though for simple use cases it works well. You can always use the ‘nginx’ front-end for those who need the additional features.
We really hope you will find the Remote Monitor web-application useful, and we’re already thinking about more features to add. But feel free to let us know what more you’d like to see there!
We’ve just updated our Remote Monitoring Web page to include the output from vcgencmd, so you can easily check if your CPU/GPU clock is being capped due to voltage or temperature issues. Just hover over the output to see a handy tool tip explanation of the hexadecimal value shown, but remember that the values are added if multiple conditions exist simultaneously. Follow our GitHub instructions to download or update the Red Reactor web server!
Cool – I can see this being useful for IoT projects – could you add measurements from external sensors which are connected to GPIO pins ?
Absolutely! The code on our Github site uses Python to take all the measurements (e.g. battery voltage, temperature), so it is really easy to add GPIO readings just like we did in our Remote Monitoring moisture sensing demonstration. This Python code simply creates a dictionary of name/value pairs which is used to populate the entries in the HTML template containing the table rows and columns. So you can just add another row and define the label and values there. The code is intended as a starting point for use in your own projects, so let us know what you’re planning to do and we’re happy to help if we can!