

Announcing our Node-RED Dashboard
We’re pleased to announce the release of our Node-RED Home Automation Dashboard, which connects to our RR_MQTT client and gives you full visibility and control of your Red Reactor powered Pi system!
Red Reactor Dashboard Features
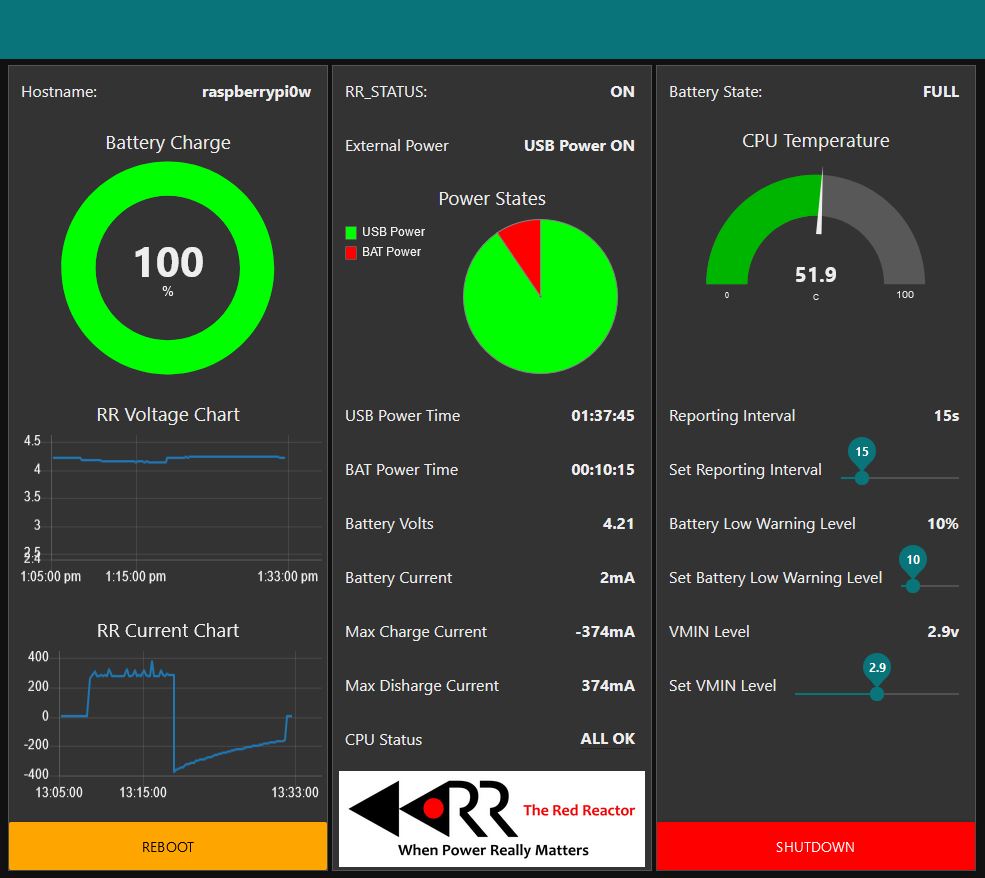
Take Control of your Red Reactor project with the Node-RED Home Automation system. The dashboard is divided into 3 groups of information:
- Battery charge, along with voltage and current history graphs
- Battery status, with clear views on battery versus USB power activity, CPU status and detailed battery usage statistics
- RR_MQTT configuration, with sliders to adjust reporting interval, warning and shutdown levels
Along with buttons for REBOOT and SHUTDOWN, the Red Reactor flow will actively monitor the conditions and provide pop-up warnings as certain status elements change, such as loss/restoration of external power, as well as battery low and imminent shutdown info.
The CPU status provides an easy to use decoded text about throttling conditions, with a mouse pop-up to explain the status fields.
Using all features of the RR_MQTT client, the information is updated at the reporting interval, and immediately when RR_MQTT detects critical changes such as external power loss.
Node-RED
Information about installing Node-RED is provided on our GitHub site, which includes the JSON file that defines the Node-RED flow and creates the dashboard UI.
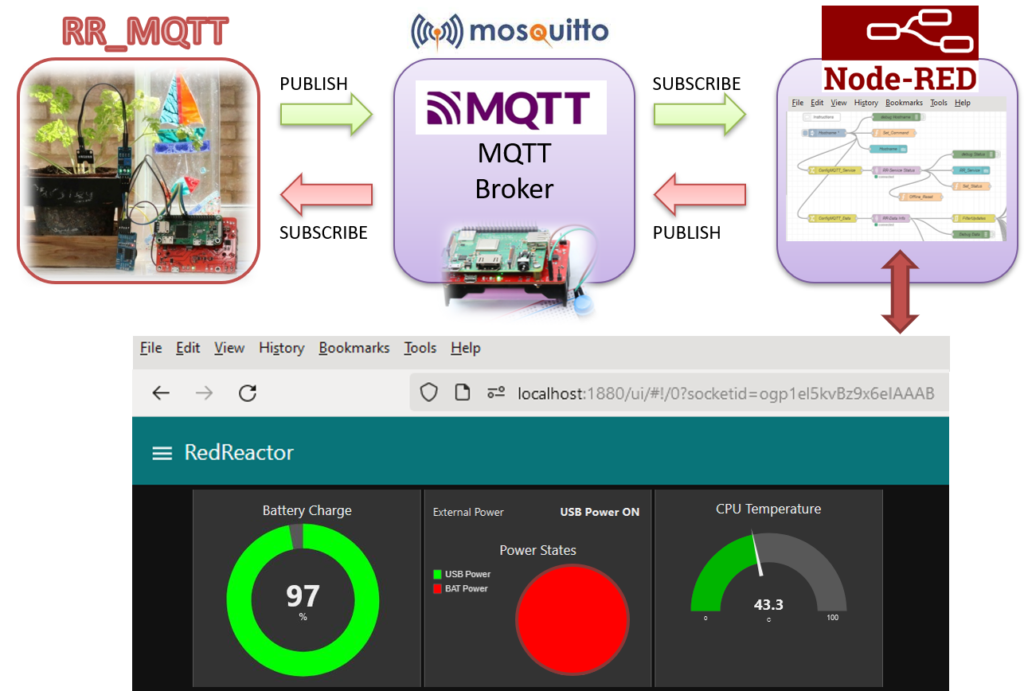
The picture above shows a simple use case. Here we have installed the Red Reactor RR_MQTT client on a remote monitoring Pi, where external power is not easily accessible. But we showed previously that this setup could run for a year with 1 reading per day, so that’s not a problem! It is connected via Wi-Fi to a Mosquitto MQTT Broker, which is perfect for running on a low power device and can be easily installed on another Raspberry Pi – with a Red Reactor battery backup to ensure no data is lost! The Node-RED server can be installed on a PC, or indeed the same low power device as the Mosquitto Broker. The Node-RED system provides browser access to both the Node-RED data flow design page, and when deployed, the Red Reactor UI Dashboard.
The RR_MQTT client publishes both the service status and a data set at configurable intervals, or as in this case, immediately on powering up. At the same time, the Red Reactor flow is subscribed to the service status and data topics, as well as being able to publish data to a command topic that enables you to control the RR_MQTT client.
The Red Reactor flow application is provided as a JSON file which you can easily IMPORT into your Node-RED setup. By configuring the Hostname to match that of your RR_MQTT client you can even create multiple TABS in your browser to cover all the Red Reactor powered devices in your setup!
Node-RED provides a ‘scratch’ programming like environment, and as well as being fun to learn it provides a very powerful way to automate interaction with your devices. For example, you could automatically change the battery warning level trigger when running your system at maximum load and high temperatures!
We hope that the Red Reactor Node-RED UI Dashboard and RR_MQTT client provide you with a great starting point to incorporate your own data sets, when running everything on your Red Reactor powered system!
Don’t forget we are live on Kickstarter, see our page here, and please check out our campaign updates and press articles too!
One thought on “Node-RED Dashboard”